Back to projects

Case study

Stakeholder Engagement Report

Turning fragmented enrolment data into actionable employer intelligence

End-to-End Business Intelligence Solution · Databricks · Azure Data Factory · Power BI · Power Query · DAX

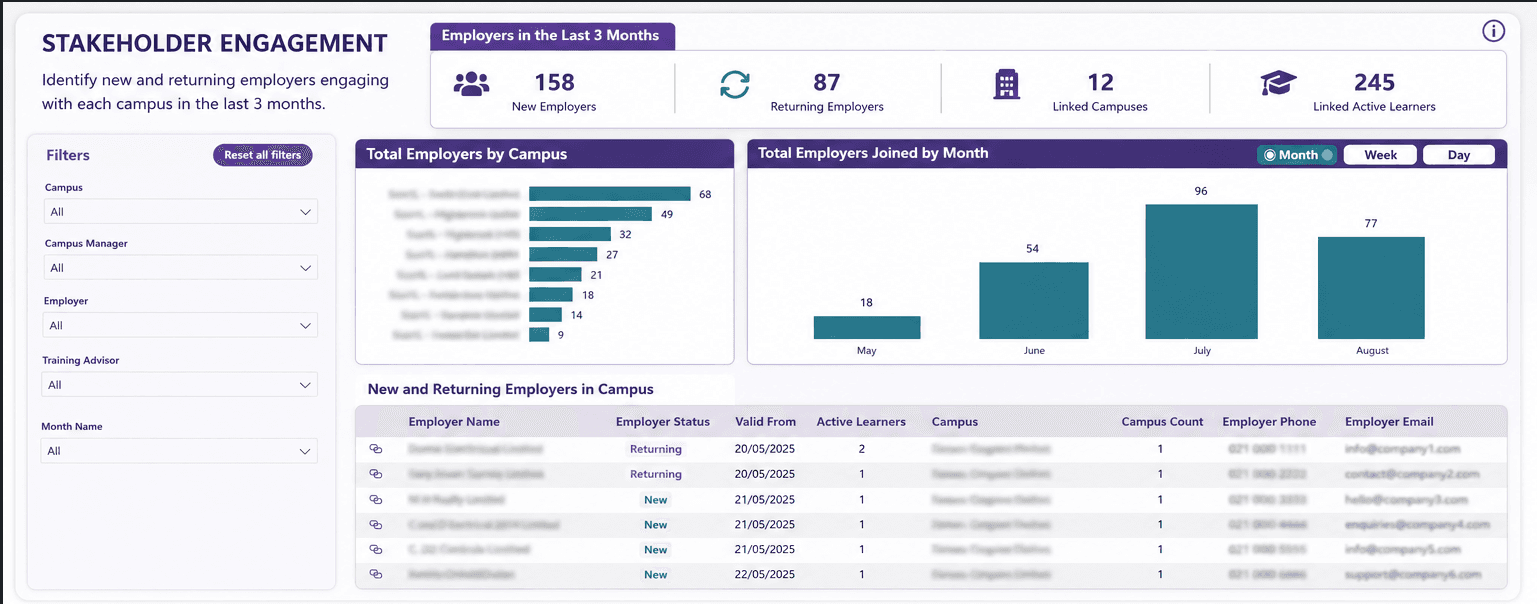
Stakeholder Engagement Report dashboard in Power BI

Overview

The Stakeholder Engagement Report was developed to solve a business visibility problem: teams had no simple way to identify new employers engaging with Skills Group at each campus.

This information was particularly valuable to Learning Delivery teams and Campus Managers, who needed visibility of new employer relationships so they could proactively welcome employers, establish contact, understand upcoming learner activity, and prepare accordingly.

However, the required relationship did not exist directly in SELMA, the source LMS.

I designed and delivered an end-to-end BI solution that derived this relationship from the underlying enrolment data, introduced business logic to distinguish New and Returning employers, and transformed the results into an interactive Power BI report.

What began as a solution for Learning Delivery later attracted interest from Sales and Marketing, who requested access to use the same employer intelligence within their own workflows.

Built for one business need. Adopted across multiple teams.


The Business Problem

The business needed to answer a seemingly simple question:

Which employers have recently started engaging with each campus?

There was no existing report providing this visibility. Without it, Campus Managers and Learning Delivery teams could not easily identify employers who had recently started sending employees for training — creating a risk that opportunities for early engagement could be missed.

The desired outcome was a reliable, easy-to-use report that let business users identify recent employer activity and act on it.


The Data Challenge

The challenge was more complex than simply extracting an employer and campus field. Within SELMA, the Learning Management System, there was no direct relationship between an employer and a campus — it had to be derived through the learner and enrolment structure.

Relationship logic: Employer → Learner → Enrolment → Programme/Course → Campus

A learner profile was associated with an employer, while the learner's enrolments contained the entities required to determine the programme or course being studied, and the associated campus. This meant bringing several parts of the data model together to establish the employer-to-campus relationship.

There was a further complication: a learner could have relationships with different employers historically, while the reporting logic needed to identify the relevant active employer relationship — not simply every historical employer associated with that learner.


Defining What "New" Actually Means

One of the key parts of the project was translating the business concept of a "new employer" into reliable data logic. The business was primarily interested in employers that had recently begun engaging, so I focused the report on employer activity within the most recent three-month period.

During analysis, I identified another scenario: some employers had previously sent employees, stopped engaging for an extended period, and then later returned. Simply treating these as existing employers would hide an important engagement opportunity — so I introduced two classifications:

New Employer — an employer whose relevant engagement began within the last three months.

Returning Employer — an employer with historical engagement that had been inactive for at least 18 months, but had begun sending learners again within the last three months.

This gave the business a more meaningful picture: instead of just identifying records that appeared recently, the report could distinguish between new relationships and re-engaged relationships.


Solution Architecture

Data flow: SELMA → Azure Data Factory → Databricks → Curated Reporting View → Power BI → Business Users

I used data available in Databricks to identify and combine the required learner, employer, enrolment, programme, and campus information.


Data Model

Deriving the employer-to-campus relationship meant bringing together several entities that had no direct connection in the source system — learners, enrolments, programmes, campuses, and organisations. Below is the semantic model I built in Power BI, with a bridge table (EmployerCampusBridge) at the centre to resolve that relationship cleanly.

Star schema data model for the Stakeholder Engagement Report, showing the EmployerCampusBridge table connecting student, enrolment, organisation, and campus entities


Databricks & Data Transformation

The organisation's data platform follows a medallion-style architecture, with data progressing through Bronze, Silver, and Gold layers. At the time of development, some of the required Silver-layer engineering work was still evolving with the Data Engineering team.

Rather than delaying delivery of the business solution, I took a pragmatic approach: I worked from the available Bronze-layer data, applied the required cleansing, transformation, and business rules, and created a curated view for reporting in the Gold layer.

Why this approach: the intended long-term architecture remains Bronze → Silver → Gold, but an interim reporting solution allowed the business to receive value sooner while the broader engineering work continued — balancing architectural awareness, business urgency, data quality, maintainability, and speed of delivery.


Power BI Development

Once the curated Databricks view was ready, I connected Databricks to Power BI, completed further preparation in Power Query, and developed the semantic model.

The reporting layer included data preparation and transformation, relationship modelling, business-rule implementation, DAX measures and calculations, employer status logic, campus-level filtering, interactive report functionality, and user-focused visual design.

The goal wasn't simply to display data — the report needed to make it easy for a business user to move from "what happened?" to "which employers should I engage with?"


From Data to Action

The completed report gave users a centralised way to identify recent employer engagement and understand which campuses those relationships were associated with — explored interactively, rather than working through disconnected source-system records.

The report provided visibility of both new employers (organisations beginning a new relationship) and returning employers (previously engaged organisations returning after an extended period of inactivity), turning underlying LMS and enrolment data into actionable stakeholder intelligence.


Quality Assurance & Delivery

Building the report was only one part of the project — I followed the internal BI delivery lifecycle to ensure the solution was validated before reaching production:

Development — developed and validated the data logic, Databricks view, Power BI model, DAX calculations, and report experience.

Peer review & testing — submitted for peer review and technical testing to validate the implementation and identify potential issues.

Repository & version control — progressed through the team's repository and controlled deployment process.

User Acceptance Testing (UAT) — provided to business users to confirm the logic reflected their requirements, the information was meaningful, it supported their workflow, and the experience was suitable.

Production deployment — deployed into the production environment following successful review and UAT approval.


Documentation, Communication & Adoption

For a BI solution to create value, users need to understand what it tells them, how to use it, and what actions they can take from it. I created supporting documentation and user guidance, prepared communications to introduce the solution to the business, and organised a walkthrough session with users covering the report's purpose, how employer classifications worked, how to navigate and filter it, how to interpret the information, and how teams could incorporate it into their day-to-day work.

Users were also given a clear channel to raise questions, provide feedback, or request further support — ensuring the project included stakeholder engagement and change adoption, not just technical delivery.


Cross-Functional Adoption

The report was originally developed primarily for Learning Delivery teams and Campus Managers. Once available, other teams recognised the underlying employer intelligence could support their work too — Sales and Marketing subsequently requested access.

Learning Delivery & Campus Management use it to identify recently engaged employers, welcome and establish contact with new ones, understand employer activity per campus, prepare for incoming learners, and maintain stronger relationships.

Sales uses the same information to identify newly engaged organisations, gain visibility of employer activity, support relationship management, and recognise opportunities for further engagement.

Marketing uses the employer view to understand recent engagement, identify relevant audiences, support targeted communications, and better understand changes within the employer base.

The report evolved from a targeted operational report into a cross-functional BI product providing a shared view of employer engagement.


Business Impact

The key value of the solution wasn't the dashboard itself — it was creating visibility where previously there was none.

  • Improved visibility — a clearer view of employers recently engaging with individual campuses
  • Earlier stakeholder engagement — teams could identify new employer relationships and engage proactively
  • Recognition of returning relationships — the 18-month inactivity logic surfaced employers re-engaging after a significant period away
  • Single source of employer intelligence — complex relationships across learners, enrolments, programmes, and campuses translated into a consumable reporting experience
  • Cross-functional value — interest from Sales and Marketing demonstrated the solution addressed a broader organisational need
  • Business adoption — documentation, communications, UAT, and walkthrough sessions supported the transition into a report teams could confidently use

My Role

  • Business analysis — understanding the visibility problem and translating stakeholder needs into reporting requirements
  • Data investigation — investigating the LMS's underlying relationships to determine how employer-to-campus relationships could be derived
  • Business rule design — defining the logic for active employer relationships and the New/Returning distinction
  • Data engineering & transformation — working with Databricks data, cleansing and combining datasets, developing the curated reporting view
  • Data modelling — preparing the reporting data and designing the Power BI model
  • Analytics development — creating DAX measures, calculations, and reporting logic
  • Report development — designing and building the interactive Power BI experience
  • Testing & QA — supporting peer review, testing, and UAT
  • Deployment — progressing the solution through the repository and production deployment process
  • Stakeholder enablement — producing documentation, communications, and user guidance, and delivering walkthrough sessions
  • Ongoing support — a point of contact for questions, feedback, and further improvements

Technology & Skills

Technologies: Power BI · DAX · Power Query · Databricks · Azure Data Factory

BI & Data skills: Data Modelling · Data Transformation · Business Rule Design · Data Quality · Data Visualisation · Dimensional Thinking

Delivery skills: Requirements Analysis · Stakeholder Engagement · Peer Review · UAT · Production Deployment · Documentation · User Training · Change Adoption


End-to-End BI Process

This project demonstrates the way I approach Business Intelligence:

  1. Understand the business problem — identify the decision users are struggling to make
  2. Investigate the data — understand source systems, relationships, limitations, and data quality
  3. Define business logic — translate concepts like "new employer" and "returning employer" into consistent analytical rules
  4. Transform & curate — clean, combine, and structure the data into a reporting-ready dataset
  5. Model & analyse — develop the semantic model, relationships, DAX, and calculations
  6. Build the experience — create an intuitive Power BI report focused on the user's decisions, not just displaying data
  7. Validate & deploy — complete peer review, testing, UAT, and controlled production deployment
  8. Enable the business — provide documentation, communication, training, and ongoing support
  9. Learn & expand — observe how the solution is used and identify opportunities for broader organisational value

Key Takeaway

This project represents more than the development of a Power BI dashboard. It demonstrates the ability to take an ambiguous business problem, investigate complex source-system relationships, define meaningful business rules, transform and model the underlying data, build an intuitive analytical product, validate it with users, deploy it into production, and support its adoption across the organisation.

Most importantly, the solution turned data that already existed within operational systems into information that teams could understand, trust, and act upon.

Business Problem → Data → Logic → Insight → Action